2019 RANSOMWARE STATISTICS
2019 RANSOMWARE STATISTICS
Ransomware infection rates are dropping but almost half of victims pay the ransom.
Ransomware has been the core concern for cybersecurity professionals for years but in 2018 it finally started to decline in volume. However, it doesn’t serve us to get excited about progress just yet, as more and more companies are paying the ransom when they do get hit.
- In 2018, enterprise ransomware increased by 12%, accounting for 81% of all successful ransomware infections (2019 Internet Security Threat Report by Symantec)
- Overall, ransomware infection rates “declined approximately 60% between March 2017 and December 2018, with intermittent increases across that period” (Microsoft Security Intelligence Report Volume 24); here are some potential factors involved in this:
There are probably many causes for this overall decline, although Microsoft security researchers suspect that a primary factor is that both end users and organizations are becoming more aware of and dealing more intelligently with ransomware threats, including exerting greater caution and backing up important files so they can be restored if encrypted by ransomware Also, as described earlier, cybercriminals are opportunistic.
Microsoft Security Intelligence Report Volume 24
- Thailand, UAE and Iran are the countries with highest share of users attacked with ransomware from 2017 to 2018. (KSN Report: Ransomware and malicious cryptominers 2016-2018)
- Mobile ransomware has skyrocketed: it increased by 33% in 2018 (2019 Internet Security Threat Report by Symantec)
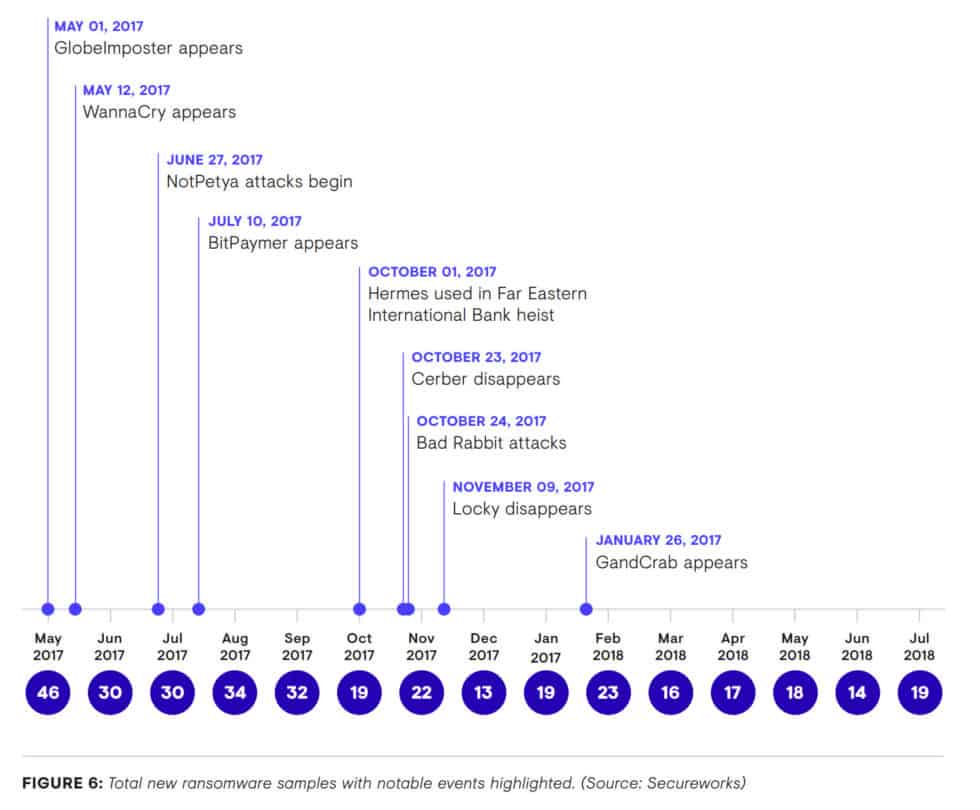
- 257 new ransomware families emerged from July 2017 through June 2018, including GandCrab, which was the most prevalent ransomware threat in the first half of 2018. (Secureworks State of Cybercrime Report 2018)
Secureworks State of Cybercrime Report 2018
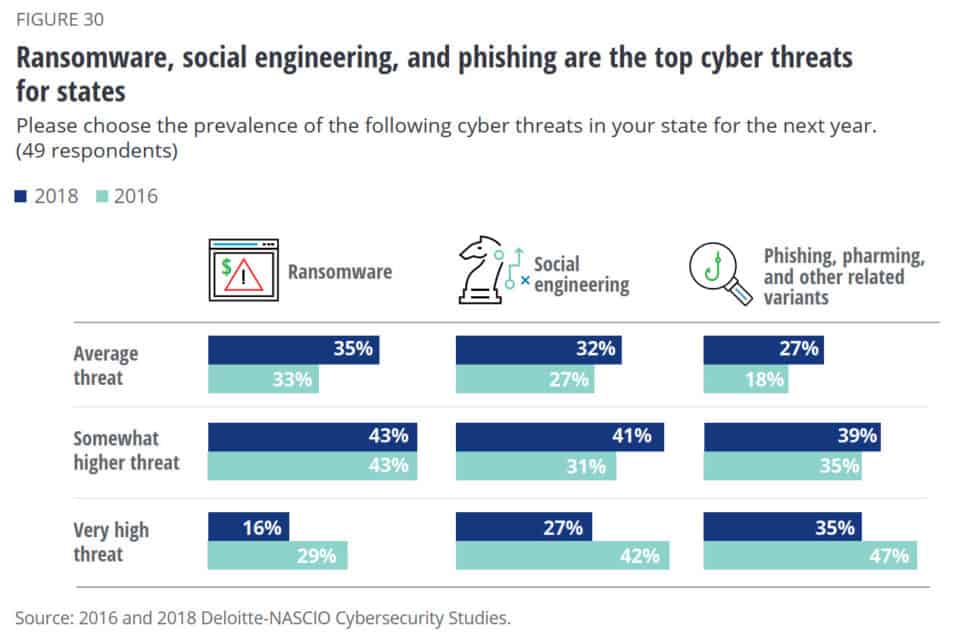
- Ransomware is also cause for serious concern for entire countries, not just for companies, as the Deloitte-NASCIO Cybersecurity Survey 2018 highlights:
What made the ransomware problem worse is that nation states got involved. Investigations proved that the WannaCry and NotPetya ransomware attack campaigns were orchestrated by nation-state actors. They may have started in 2017, but their effect continued throughout 2018. The objective was to destroy information or cause distractions rather than to derive financial benefits.
The ENISA Threat Landscape Report 2018 shows that ransomware is still a huge cause for concern for any type of organization across sectors, irrespective of its size and complexity:
- 39% of the global data breaches caused by malware were ransomware
- 17% of the total UK healthcare data breaches were actually ransomware
- 64% of all major incidents targeting industrial control systems or networks were also ransomware
- Almost all cybercrime incidents focusing on educational institutions were ransomware – around 70% of them
There is some good news among all these bleak ransomware statistics:
58.8% of the respondents to a security incident were using tools for ransomware prevention and 83% of them claimed that these tools were helpful
ENISA Threat Landscape Report 2018
The same report highlights a few other interesting cyber attacks facts and figures:
- 5,4 billion WannaCry attacks were blocked in 2017, which is an astounding number by itself
- With so many blocks, it’s clear that WannaCry was the most common ransomware attack in 2017 at 53.92%, with GandCrab coming in second with 4.92% (boomed in 2018, as we mentioned above)
- Even if 66% of companies recognize that ransomware is a serious threat, less than 13% of them were prepared for such an attack in 2017
- In spite of intense focus on preventing these attacks, approximately 1% of the infected endpoints were still attacked by ransomware
- Ransomware hit 15% of businesses in the top 10 industry sectors, such as education, IT/telecom, entertainment, financial services, construction, government, manufacturing, transport, healthcare, and retail.
What’s more, enterprises accounted for 81% of all ransomware infections the company registered. (2019 Internet Security Threat Report by Symantec)
Individual users weren’t spared either: 158,921 unique users had their computers and data encrypted with malware in Q2 2018.
The threat also targeted mobile platforms: over 20,000 installations of mobile ransomware Trojans were detected in the H1 2018.
In terms of distribution, email is still the preferred vector for spreading encrypting malware:
- 65% of the ransomware attacks were delivered via email and just 35% via malicious URLs
- 93% of all phishing emails were related to spreading ransomware
- 36% of all malicious email in Europe and Japan was related to – you guessed it! – ransomware (ENISA Threat Landscape Report 2018).
During 2018, the chief ransomware distribution method was email campaigns. Enterprises tend to be more affected by email-based attacks since email remains the primary communication tool for organizations.
2019 Internet Security Threat Report by Symantec
The numbers show that ransomware continues to be a growing threat in the healthcare industry. In 2017, more than 85% of all malware that infected healthcare organizations was ransomware. Without proper defenses in place, the trend is likely to continue. (ENISA Threat Landscape Report 2018)
Cyber-ransom continued to be the leading motivation of hackers and was the reason for 51% of the attacks.
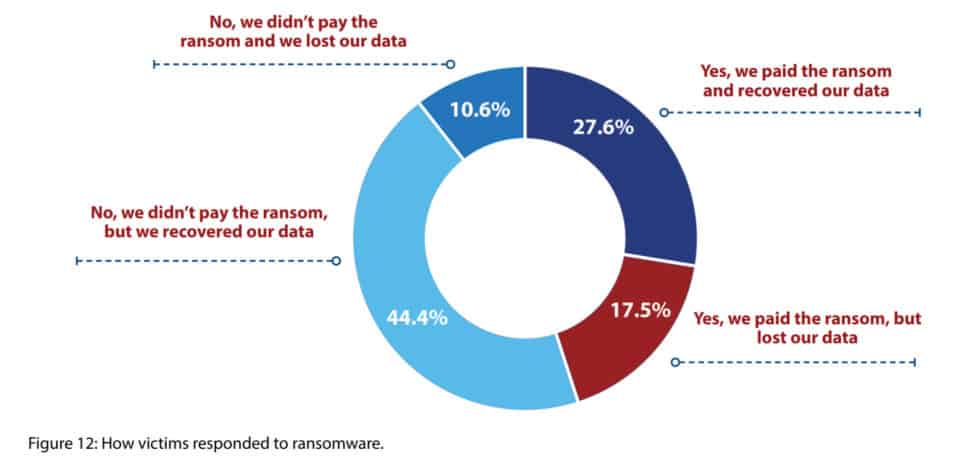
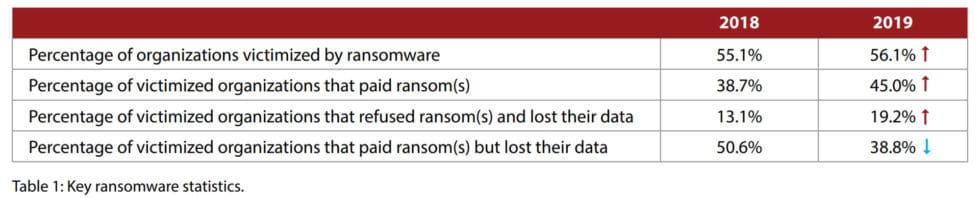
While ransomware infection rates are declining, increasingly more companies choose to pay the ransom. Almost half of organizations hit by ransomware pay to get their data unlocked, further fueling cyber criminal activities.
The percentage of victimized organizations that paid associated ransoms rose considerably this year, from 38.7% to 45.0%” mentions Imperva in their 2019 Cyberthreat Defense Report.
Imperva 2019 Cyberthreat Defense Report
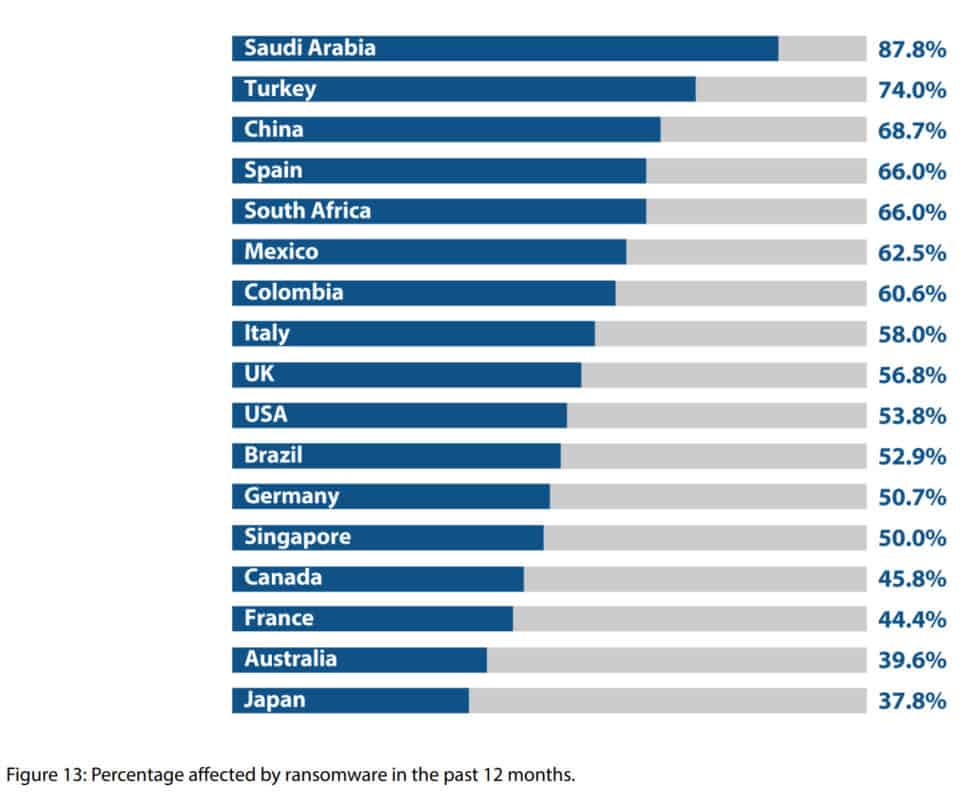
In terms of geographical distribution, ransomware hit Saudi Arabia (87.8%), Turkey (74%), and China (68.7%) the hardest in 2017, according to the Imperva 2019 Cyberthreat Defense Report.
Because cybersecurity is a discipline with widespread implications and interdependencies, we’re going to dive into the most prominent attack tactics next. Reports from 2018 and 2017 overflow with data that both concerns companies across industries and addresses particular issues.
Favored cyber attack tactics include cryptojacking (+629%) and encrypted communication (+300%)
Ransomware may have slightly declined in 2018 but cryptojacking attacks increased in volume by 400%, stealing the spotlight (2019 Internet Security Threat Report by Symantec).
Cybercriminals now spread malware that infects victims’ computers and unlawfully uses their processing power to mine cryptocurrency, such as Bitcoin or Monero.
The dropping value of cryptocurrencies may have weakened interest in ransomware but mining for virtual currencies is still hugely relevant.
Cyber criminals are moving from ransomware to cryptojacking. While the growth of ransomware has been slower, threat actors have moved to cryptojacking as it is simpler, more profitable and less risky for them. It is expected that cyber criminals will be leveraging cryptojacking at scale, continue embedding cryptoming capabilities to malware families and mostly focus on targeted ransomware campaigns.
ENISA Threat Landscape Report 2018
In its report, ENISA notes that cryptojacking malware skyrocketed by 629% (from 400,000 samples in Q4 2017 to 2.9 million samples in Q1 2018).
During the first half of 2018, it was estimated that cryptominers have monetized for their users more than US $2.5 billion. Smominru mining botnet that has infected more than 500.000 Windows machines has already mined Monero, valued between US $2,8M and US $3,6M.
It was estimated that an adversary controlling 2,000 victim computer systems with Monero miners could generate US $500 per day or US $182,500 per year.
ENISA Threat Landscape Report 2018
But cryptojacking is not the only attack giving CISOs, CIOs, and IT managers more trouble than they can handle. Statistics show that several threat vectors are cause for concern.
- Cybercriminals are quick to find ways to get around strengthened security; supply chain attacks grew 78% in 2018 (2019 Internet Security Threat Report by Symantec)
- Another study corroborates this insight and provides more context: “companies that have experienced 50% or more of their breaches from indirect attacks—targeted at their organization but initiated through partner organizations—are more likely to join or lead efforts to ensure the trustworthiness of the Internet economy” (Accenture – Securing the Digital Economy)
- Cybercriminal tactics often leverage available information: 63 percent of network intrusions are the result of compromised user passwords and usernames. (Microsoft)
- Malicious documents are also a well-known infection vector that hasn’t lost its popularity: in its 2018 Annual Cybersecurity Report, Cisco found that, globally, 38% percent of malicious email attachments were Microsoft Office formats such as Word, PowerPoint, and Excel. (Cisco)
- Archive files, the likes of .zip and .jar, represent around 37% of all malicious file extensions Cisco observed, with malicious PDF files accounting for 14% of the total. (Cisco)
Besides the already classic attack vectors, cybercriminals are also looking to piggyback on the boom in ecommerce and online shopping:
While attacks on household names make headlines, Symantec’s telemetry shows that it is often small and medium sized retailers, selling goods ranging from clothing to gardening equipment to medical supplies, that have had formjacking code injected onto their websites. This is a global problem with the potential to affect any business that accepts payments from customers online.
2019 Internet Security Threat Report by Symantec
The increasing adoption of cloud-based platforms is still leaving cybersecurity professionals playing catch-up:
- 93% of companies deal with rogue cloud apps usage (Imperva 2019 Cyberthreat Defense Report)
- 82% of cloud users have experienced security events caused by confusion over who is responsible to secure the implementations (Oracle and KPMG Cloud Threat Report 2019)
Imperva 2019 Cyberthreat Defense Report
Here are some key statistics that highlight the diversity in malicious tactics and strategies:
- 35 percent of companies in a global survey were targeted by an SSL or TLS-based attack (Gartner)
- Fileless attacks were used in 77% of successful compromises in 2018 because they’re increasingly effective at evading detection; as a consequence, the trend is bound to increase (ENISA Threat Landscape Report 2018)
- Financial trojans may have steadily declined in volume but they’re still one of the biggest threats against consumers; the most prevalent financial trojans of 2018 are Zeus, Emotet, URLzone, Ursnif, and Trickbot (ENISA Threat Landscape Report 2018)
- Open-source malware is increasingly used by cybercriminals of all levels and backgrounds to make illicit profits because it makes scaling their operations and attribution a lot less challenging (ENISA Threat Landscape Report 2018)
- In 2018, polymorphic malware accounted for 94% of all malicious executables (2018 Webroot Threat Report)
- The use of encrypted Command and Control (C2) communication increased by 300% in 2018 (ENISA Threat Landscape Report 2018)
ENISA Threat Landscape Report 2018
Physical attacks are also on the rise, as cybercrime statistics show:
- 30% of reported data breaches in retail were caused by payment card skimming attacks (ENISA Threat Landscape Report 2018)
- 87% of the reported card skimming attacks target petrol stations (ENISA Threat Landscape Report 2018)
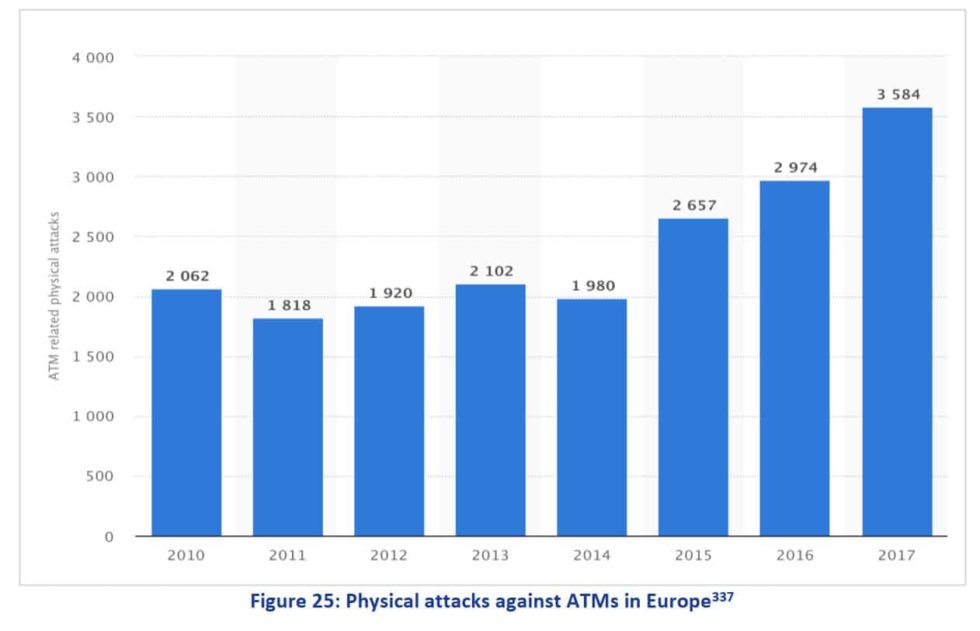
- During 2017, almost 3,600 physical attacks against banking ATMs were reported in Europe, 20% more than in 2016 (ENISA Threat Landscape Report 2018)
- Black box ATM attacks increased by 307% in Europe, as reported by the European Association for Secure Transactions (EAST), with related losses hiking by 268%, from €0,41 million to €1,51 million
ENISA Threat Landscape Report 2018
The numbers are climbing when it comes to internal threats, too: 54% more organizations recorded a growth of insider threats in 2018 (ENISA Threat Landscape Report 2018).
ENISA Threat Landscape Report 2018
Motivations are also changing, moving from making money through nefarious tactics to collecting data that can be used to cash out on multiple subsequent attacks:
The most likely reason for an organization to experience a targeted attack was intelligence gathering, which is the motive for 96 percent of groups.
2019 Internet Security Threat Report by Symantec
EY – Global Information Security Survey 2018-2019
DDos attacks grow in both strength and frequency
With more unsecured devices connecting to the internet than ever, cybercriminals are taking full advantage of their processing power. Once recruited into botnets, they harness their collective power to launch powerful DDoS attacks that companies can barely survive.
Here are some statistics that illustrate this growing issue:
- In 2018, DDoS attacks over 10Gbps increased 100% (Full Year 2018 DDoS Trends Report by Corero)
- Worryingly, more than 400,000 DDoS attacks are reported each month across the globe. (Calyptix Security)
- In the first half of 2018, the industry with the highest number of reported DDoS attacks was the wired telecommunications carrier industry, with almost 800,000 attacks during that period. (Calyptix Security)
- DDoS attacks lasting under 90 minutes made up 55.28% of the total, while those lasting longer accounted for 44.72%. A small 4.62% lasted longer than 20 hours! (ENISA Threat Landscape Report 2018)
- The average duration of a DDoS attack in 2017 was 318.10 minutes, while the longest attack lasted a shocking 6 days, 5 hours, and 22 minutes (ENISA Threat Landscape Report 2018)
Cyberassaults resulting in a complete outage or service disruption grew by 15%, and one in six organizations reported having suffered a 1Tbps attack.
The Trust Factor by Radware
Phishing grows by 250% and gets difficult to spot
Malicious hackers and scammers are getting craftier at creating and sending phishing emails that trick even the most cautious users. The data shows that this is a constant cause for concern with no sign of slowing down in terms of effectiveness.
- Scammers and attacks send out 6,4 billion fake emails every day (EY – Global Information Security Survey 2018-2019)
- Almost 87% percent of the Fortune 500 are vulnerable to phishing, leaving their customers, employees, and brand name exposed to a fraud (Q4 2018: Email Fraud and Identity Deception Trends by Agari)
- Only 5% of companies have implemented a Quarantine policy to send phishing emails to the spam folder. (Q4 2018: Email Fraud and Identity Deception Trends by Agari)
- Verizon reports that 30 percent of phishing emails in the U.S. are opened, with 12 percent of those targeted by these emails clicking on infected links or attachments (Verizon)
- Phishing social media users tripled during 2017 as attackers leveraged the inherent trust consumers have in these platforms (ENISA Threat Landscape Report 2018)
- Microsoft reported a huge increase of 250% in phishing emails between January and December 2018, analyzing more than 470 billion email messages every month for this particular threat and for malware. (Microsoft Security Intelligence Report Volume 24)
- The volumes are enormous even for specific attacks: a single campaign during Q1 2018 sent out 550 million phishing emails over that 3-month period (EY – Global Information Security Survey 2018-2019)
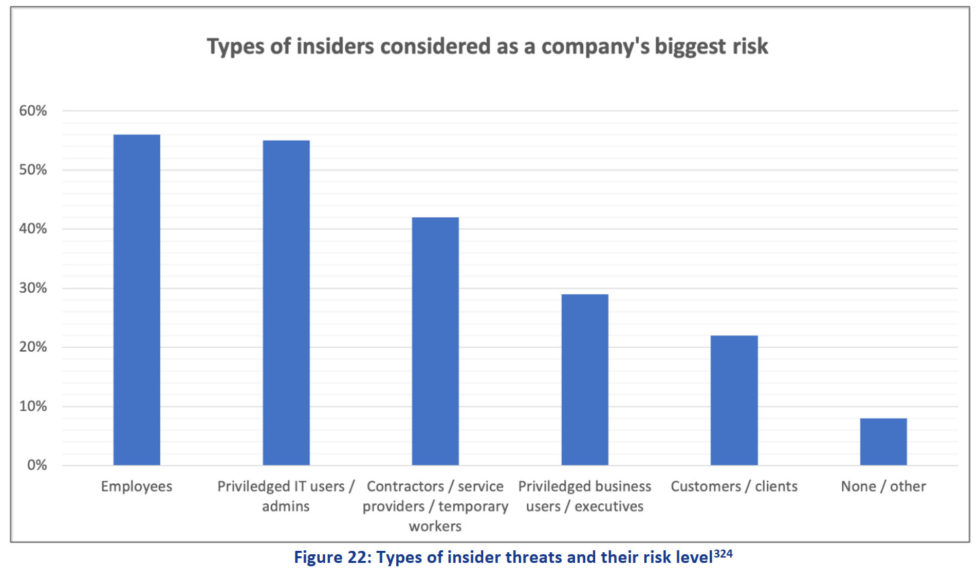
- The business world is also aware of this gigantic issue: 22% of surveyed decision makers see phishing as the biggest threat (EY – Global Information Security Survey 2018-2019)
- 30% of phishing sites used HTTPS in 2017 compared to just 5% during 2016, a trend experts believe will continue to grow (ENISA Threat Landscape Report 2018)
- In 2017, phishing campaigns have been reported to be short-lived: phishing websites typically stayed online for 4-8 hours (ENISA Threat Landscape Report 2018)
- What’s more, in 2017, phishers used 28% more malicious attachments compared to malicious URLs in the phishing emails they sent (ENISA Threat Landscape Report 2018)
- 41% of phishing domains include a single character swap, 32% have an additional character, and 13% have added or removed leading or final domain’s characters to confuse and deceive their victims (ENISA Threat Landscape Report 2018)
The ENISA Threat Landscape Report 2018 also mentions that:
The 10 most frequent words in malicious emails during 2017 were:
- delivery (12.1%),
- mail (11.8%),
- message (11.3%),
- sender (11.2%),
- your (11.2%),
- returning (7.6%),
- failed (7.6%),
- invoice (6.9%),
- Images (6.6%),
- and scanned (6.5%)
Tuesday has been observed as the most popular day for phishers to conduct their campaigns while the least popular day was Friday.
Most frequent words used within BEC phishing emails are:
- payment (13.8%),
- urgent (9.1%),
- Request (6.7%),
- attention (6.1%),
- important (4.8%),
- confidential (2.0%),
- immediate response (1.9%),
- transfer (1.8%),
- important update (1.7%)
- and attn (1.5%).
The most popular attachment name categories used in the attachments of BEC phishing attacks were:
- Purchase Order,
- Payment,
- Invoice,
- Receipt,
- Slip,
- Bill,
- Advice
- and Transfer.
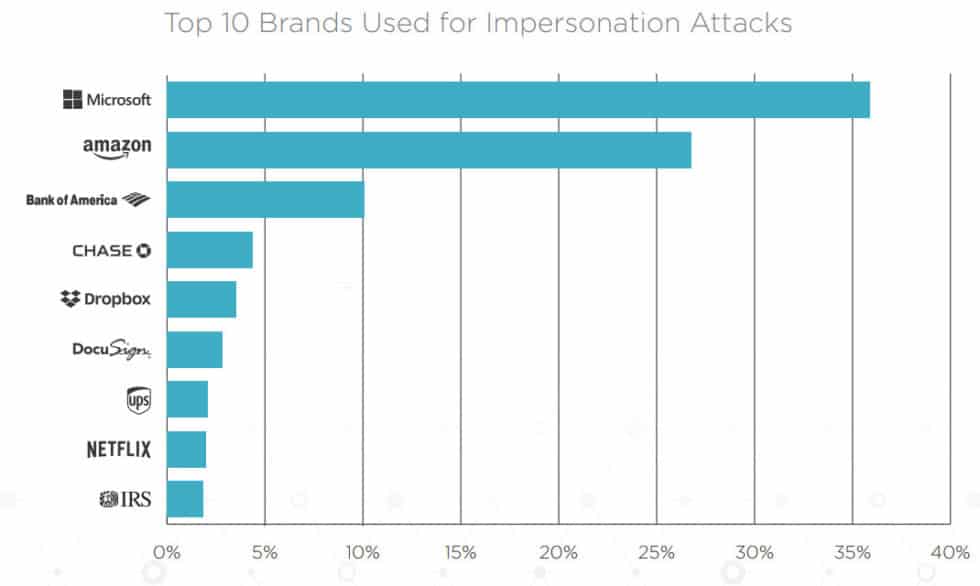
Phishing and other types of email fraud rely heavily on impersonation to make their attacks more effective. Displaying fake display names to deceive victims is preferred by bad actors over typosquatting or domain spoofing.
During July 2018 through October 2018, Agari data indicates 62% of all identity-deception based attacks leveraged display name deception aimed at impersonating a trusted individual or brand—typically an outside vendor, supplier or partner.
Q4 2018: Email Fraud and Identity Deception Trends by Agari
- The most frequently impersonated brands are Microsoft (35.87% of the time) and Amazon (26.79% of the time). (Q4 2018: Email Fraud and Identity Deception Trends by Agari)
Q4 2018: Email Fraud and Identity Deception Trends by Agari
- When it comes to fooling executives, scammers, spammers, and other bad actors leverage the trust people have in Microsoft and Dropbox:
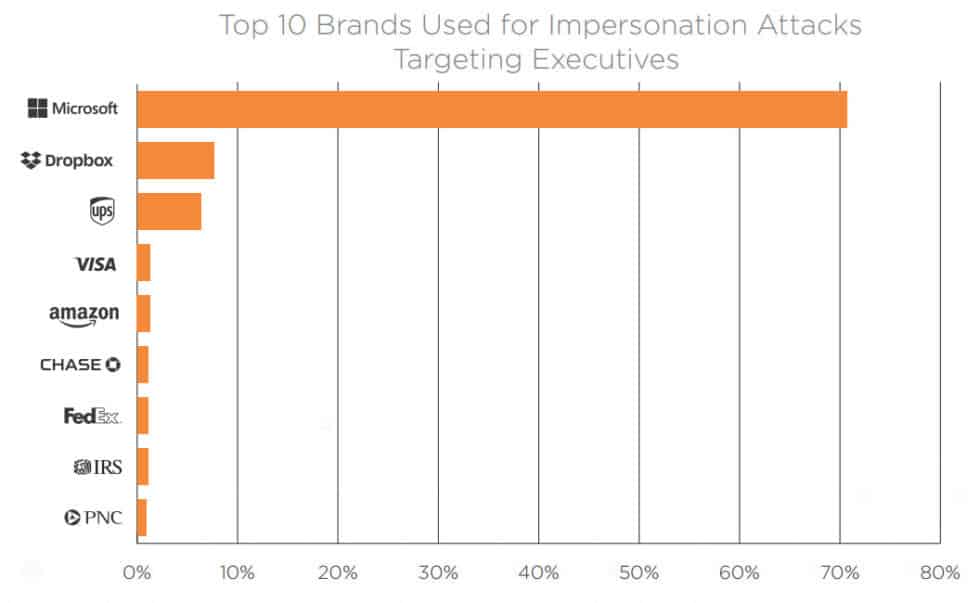
Q4 2018: Email Fraud and Identity Deception Trends by Agari
Channels may change, but spam is one of those attack tactics that’s bound to stick with us for the foreseeable future and quite possibly beyond it.
Spam remains the leading means by which criminals deliver malware. Infections via web exploit kits continued to drop precipitously as browser vendors improved security and the use of technologies like Flash and Java declined.
Secureworks State of Cybercrime Report 2018
- The average daily spam volume rose to 295,62 billion emails. Compare this to the average of daily legitimate email volume, which is 51,18 billion, and the picture becomes clear. Of the total email volume, legitimate email is just 14.76% while spam makes up the rest of it at 85.23%. (ENISA Threat Landscape Report 2018)
- 75% of spam most commonly breaks into: health related spam (26.6%), malware delivering spam (25.7%) and spam for online dating sites (21.4%). The remaining 25 percent includes: stock spam (4.6%), fake job offers (3.5%), phishing spam (2.1%), financial spam (1.9%) and adult spam (1.5%). (ENISA Threat Landscape Report 2018)
And it’s not just that spam comes in volumes. It’s also getting localized and, as a result, more convincing.
While one year ago 96% of the spam was in English, the levels of spam in English have fallen to 90%. This indicates a trend that spam is getting more “international” and localized.
ENISA Threat Landscape Report 2018
Cybercriminals are not content with just using the billions of email addresses leaked through data breaches. They’re also validating their lists of potential victims and bypass spam filters in ever clever ways:
Another interesting technique that spammers used during the reporting period was the abuse of subscription forms.
Spammers used a script that auto-filled subscription forms of regular websites and inserted the target email address in the “Email” form as well as a short message with a spam link in the form of the “Name”. Thus, the targets received an automatic “list subscription” confirmation email that contained a spam link instead of their name.
Spammers wanted to fool email filters since usually the content of “list subscription” confirmation emails is normally allowed.
ENISA Threat Landscape Report 2018
- China and India are home to the most prolific spam bots in the world, serving fake and malicious emails in overwhelming volumes:
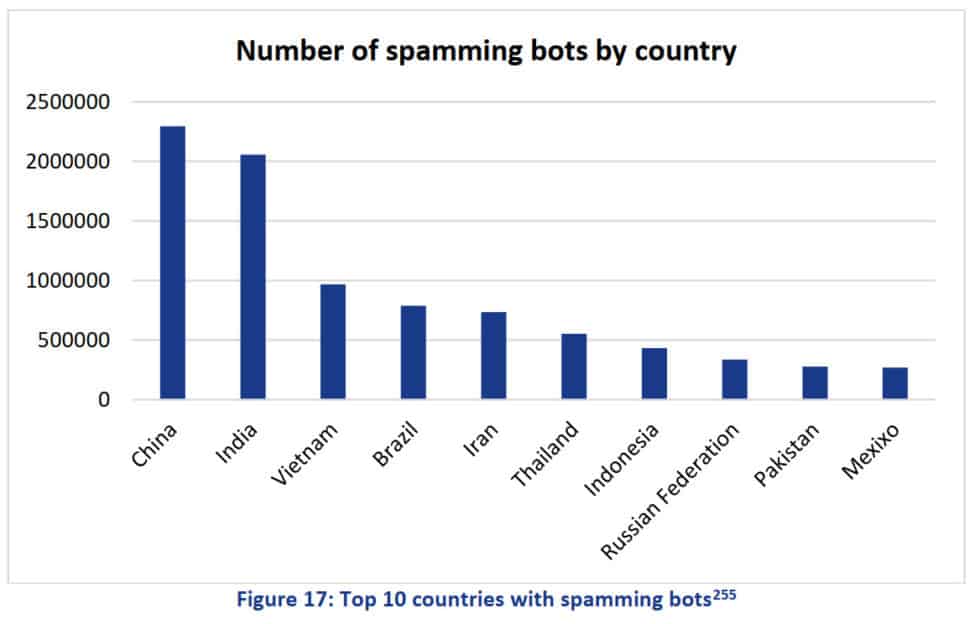
ENISA Threat Landscape Report 2018
As you’d expect, spammers have also taken to social media. From fake lotteries and coupons to fictitious giveaways from popular retailers, they’re using past experience to hook unsuspecting victims:
A recent survey reported that 47% of social media users are seeing more spam in their feeds (79% of which believe that spam content on social media includes fake news).
ENISA Threat Landscape Report 2018
Most cybercrime now leverages mobile channels
More devices, more problems. From BYOD to malicious apps with millions of downloads, cybercriminals have plenty of opportunities to exploit, scam, and extort victims in both corporate and private environments.
- Most cybercrime is now mobile. Over 60% of online fraud is accomplished through mobile platforms. Additionally, 80 percent of mobile fraud is carried out through mobile apps instead of mobile web browsers. (RSA)
- The bad news is there’s no shortage of online dangers: in 2018, Symantec blocked an average of 10,573 malicious mobile apps per day. Malicious apps most frequently infiltrated into the following categories: Tools (39%), Lifestyle (15%), and Entertainment (7%). (2019 Internet Security Threat Report by Symantec)
- According to ThreatMatrix, mobile fraud rose 24 percent year-over-year in the beginning of 2018, with over 150 million global attacks in the first half of the year. (ThreatMatrix)
- The US saw the worst of the mobile fraud risk, with a 44 percent year-over-year increase. (ThreatMatrix)
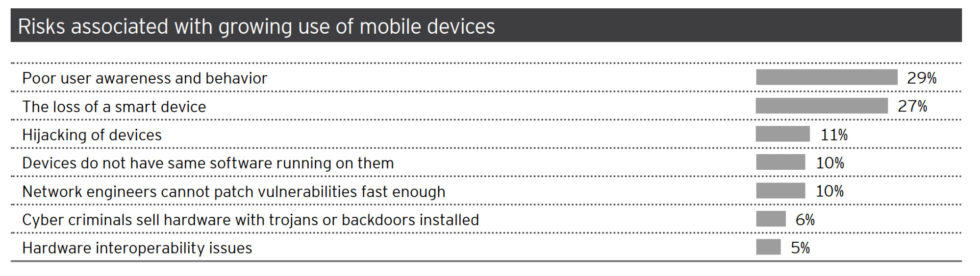
- In corporate contexts, decision-makers are aware of the issue: 83% of them said that their organization was at risk from mobile threats and 86% agreed that mobile threats are growing faster than others (Verizon Mobile Security Index 2019)
- What amplifies the issue is the lack of preparedness: 67% of organizations confessed they are less confident about the security of their mobile assets than other devices in their network (Verizon Mobile Security Index 2019)
- In spite of these realizations, 48% of companies said they sacrificed mobile security to “get the job done” in 2018 compared to 32% in 2017 (Verizon Mobile Security Index 2019)
- Consequences are inevitable: 33% of surveyed organizations suffered a compromise involving a mobile device in 2018 whose impact was significant (Verizon Mobile Security Index 2019)
- 62% of compromised companies described the incident as “major” (Verizon Mobile Security Index 2019)
EY Global Information Security Survey 2018-2019
- The largest volume of mobile malware was hosted in 3rd party app stores; most mobile malware was found in the Lifestyle (27%) and Music & Audio (20%) categories (ENISA Threat Landscape Report 2018)
- Mobile fraud is overtaking web fraud. 65% of fraud transactions start on mobile devices (RSA 2018 Current State of Cybercrime)
- Since 2015, fraud carried out through mobile apps increased by 600% (RSA 2018 Current State of Cybercrime)
- Phishing attacks on mobile devices have increased by an average of 85% year-over-year since 2011 (ENISA Threat Landscape Report 2018)
- Over 26 billion robocalls were made to US phones alone in 2018, which makes for a 46% year-over-year increase in volume (Hiya Robocall Radar 2018 Report)
- Scam calls that start on mobile channels will represent 80% of all scam calls by the end of 2019 (First Orion Scam Call Trends and Projections Report Fall 2018)
Managing cybersecurity vulnerabilities improves but still troubles companies and countries around the world
Software and hardware vulnerabilities continue to be topics of prime importance for the tech world. Meltdown and Spectre made headlines throughout 2018 and that’s likely to continue in 2019 as well.
Let’s explore some highlights that stand out from the numerous reports cybersecurity companies created on the topic:
- The number of reported application vulnerabilities in 2017 was more than double the number found in 2016 (2018 Application Security Research Update)
- What’s more, a whopping 90% of applications had at least one issue outside of the OWASP Top 10 in 2018 and 49% of tested apps had a critical or high-severity weakness that’s also outside this top 10 (2018 Application Security Research Update)
- Although vulnerabilities increase when integrating or working with third parties, only 15% of organizations have basic security controls in place to deal with this issue (EY Global Information Security Survey 2018-2019)
- 36% of surveyed organizations are aware of 3rd party vulnerabilities through self-assessments (22%) or independent assessments (14%) but this leaves 64% of companies with zero visibility on this issue (EY Global Information Security Survey 2018-2019)
- 35% of larger companies have a formal and up-to-date threat intelligence program compared to 25% of smaller organizations (EY Global Information Security Survey 2018-2019)
EY Global Information Security Survey 2018-2019
- 2018 was the third consecutive year when organizations mentioned app development and testing as the most challenging security process for them (Imperva 2019 Cyberthreat Defense Report)
- On the bright side, 78.7% of organizations considered their organization made improvements in managing vulnerabilities and handling patch management (Imperva 2019 Cyberthreat Defense Report)
- Still, over 75 percent of large companies (500+ employees) rely on the antivirus software that came pre-installed on their computer equipment, which may not be the most effective countermeasure (NDIA 2019 Cybersecurity Report)
Reports show that security vulnerabilities in web apps continue to be the leading cause of security breaches, which puts this issue at the top of CISOs’ tasks lists across the world.
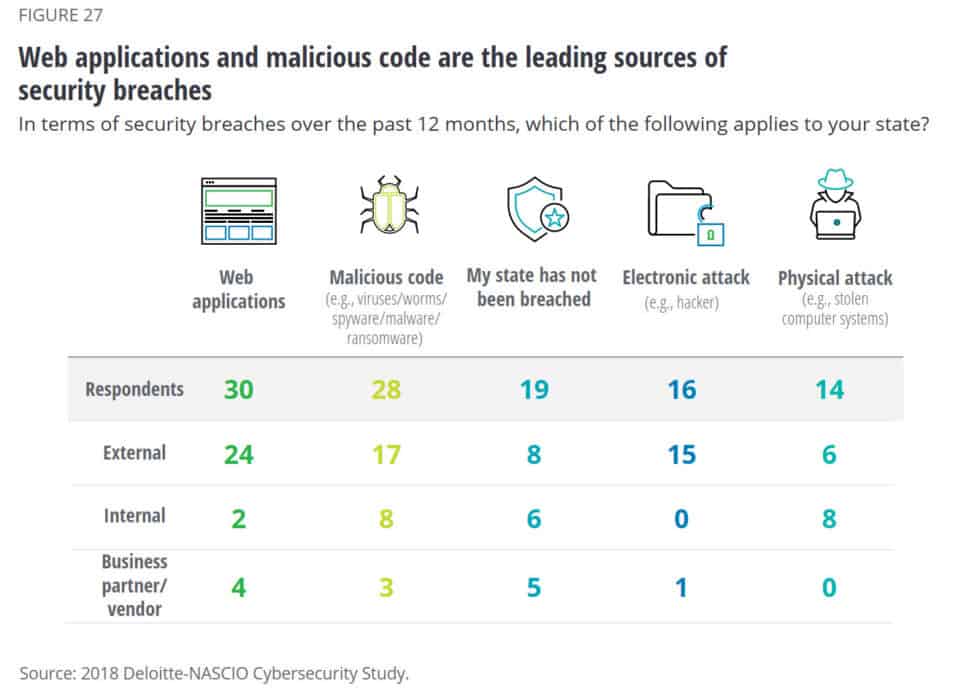
Deloitte-NASCIO Cybersecurity Survey (2018)
In one incident, the health records of almost 100 million patients worldwide were put at risk by security bugs found in one of the world’s most widely used patient and practice management systems.
EY – Global Information Security Survey 2018-2019
What’s more, the issue is so pervasive that even countries are working on this aspect:
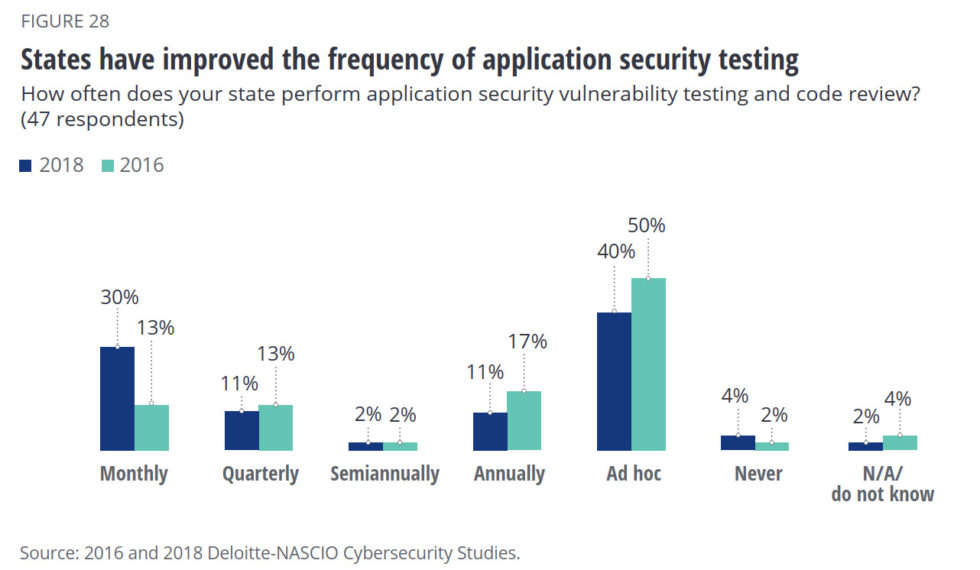
Deloitte-NASCIO Cybersecurity Survey 2018
In terms of attacks that seek to exploit software and hardware vulnerabilities, tactics abound:
- 51% of attacks targeting web applications are SQLi attacks (ENISA Threat Landscape Report 2018)
- Local File Inclusion comes in second place with 34% and Cross-Site Scripting comes in third with 8% (ENISA Threat Landscape Report 2018)
- Another report puts Cross-Site Scripting at 40% of all web attacks observed in 2017 (2018 Trustwave Global Security Report)
- In EMEA, 42% of all cyber attacks were focused on compromising web apps (ENISA Threat Landscape Report 2018).
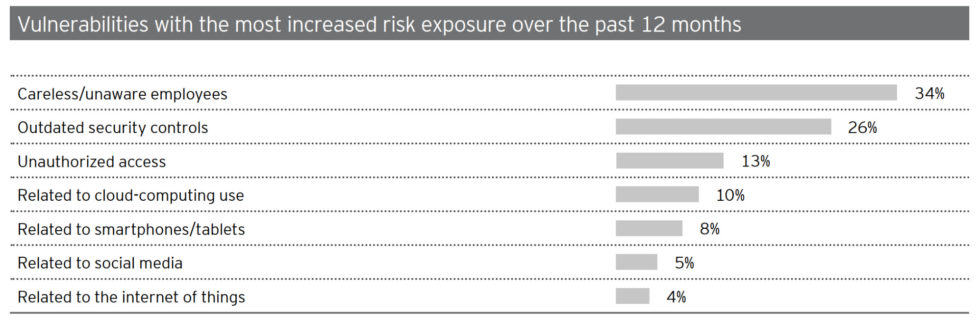
But not all vulnerabilities are related to software or hardware. EY reports in its Global Information Security Survey (2018-2019) that 34% of organizations see careless or unaware employees as their biggest vulnerability.
The volume of IoT attacks remains constant
As the number of IoT devices continue to multiply wildly, so do the security issues associated with it. The numbers speak for themselves.
The number of Internet connected devices is expected to double from 2015 to 2020 to reach 30 billion devices worldwide.
Mozilla Internet Health Report 2018
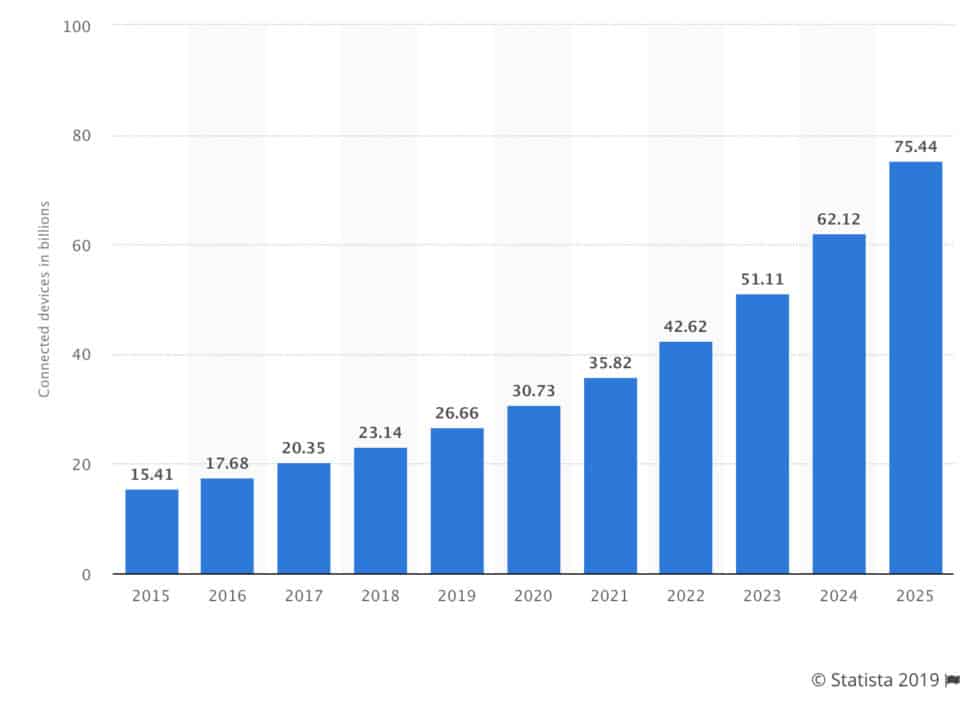
Other reports suggest that the number of IoT devices installed worldwide from 2015 to 2025 will reach 75,44 billion.
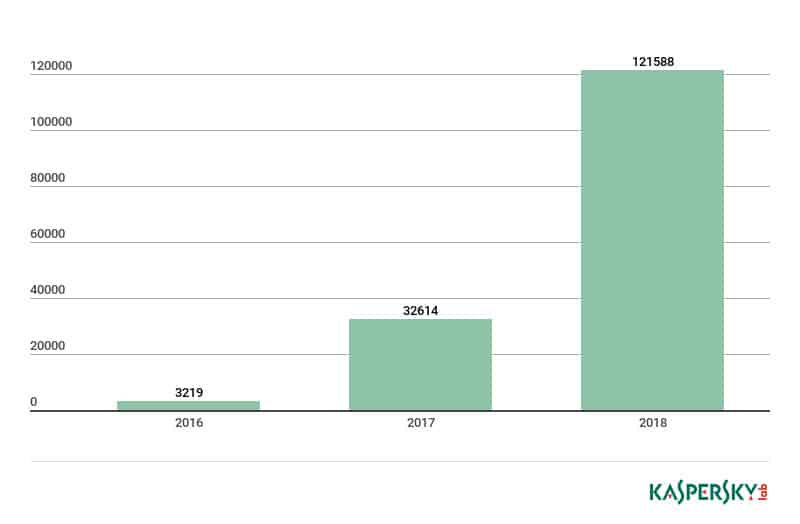
- In the first half of 2018, Kaspersky detected three times as many malware samples targeting smart devices as they did throughout the entire previous year (Kaspersky Lab)
- Cracking default Telnet passwords was the most popular attack tactic against Iot devices (Kaspersky Lab)
- Malware from the Mirai family was used in 20.9% of IoT infections (Kaspersky Lab)
- In 2018, VPNFilter malware compromised around 500,000 devices worldwide, building a massive network its creators could use to remain anonymous (ENISA Threat Landscape Report 2018)
The overall volume of IoT attacks remained high in 2018 and consistent compared to 2017. Routers and connected cameras were the most infected devices and accounted for 75 and 15 percent of the attacks respectively.
2019 Internet Security Threat Report by Symantec
- For organizations, the top 3 challenges related to IoT security are knowing their assets (14%), detecting suspicious traffic (12%), and ensuring the security controls match current cybersecurity challenges (11%) (EY Global Information Security Survey 2018-2019)
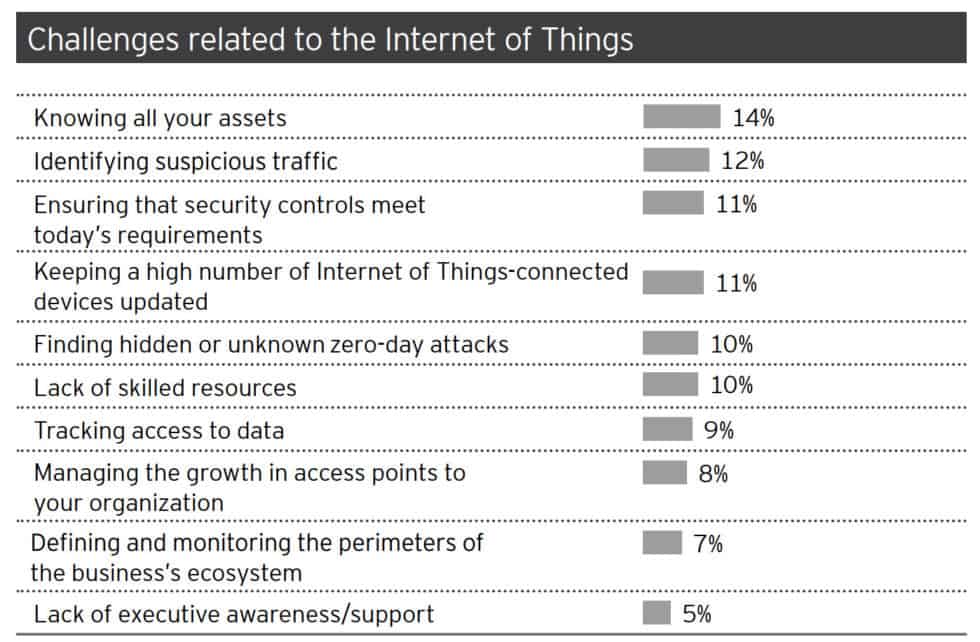
EY Global Information Security Survey 2018-2019
- Estimations project that IoT security spending is growing at a Compound Annual Growth Rate of 44% and will reach almost $4.4 billion by 2022 (IoT Security Market Report 2017-2022)
- Between 2015-2017 most of IoT security breaches were caused by malware (IoT Security Market Report 2017-2022)
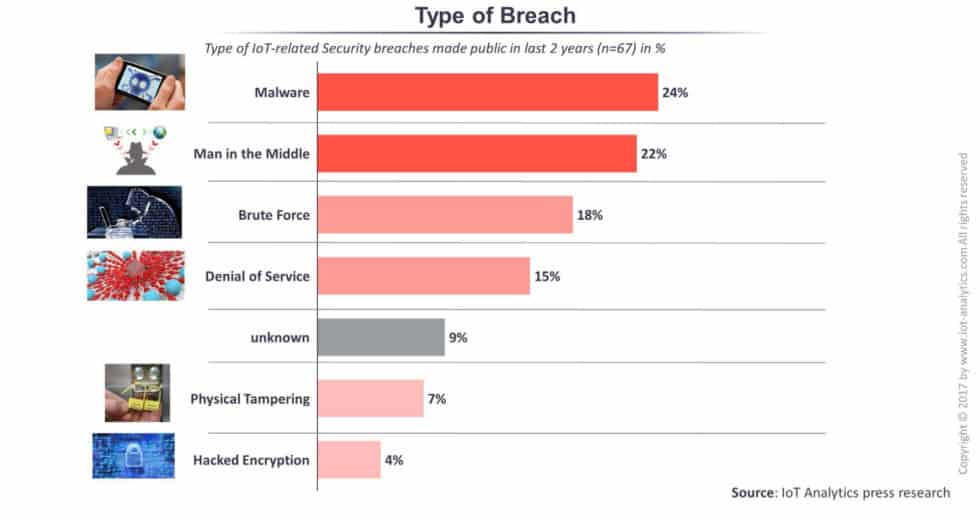
IoT Security Market Report 2017-2022
- As we’ve seen, default passwords are the core attack tactic, so the biggest IoT security issues that need to be solved are authentication/authorization (32%), followed by access control (15%) and data encryption (14%) (IoT Security Market Report 2017-2022)
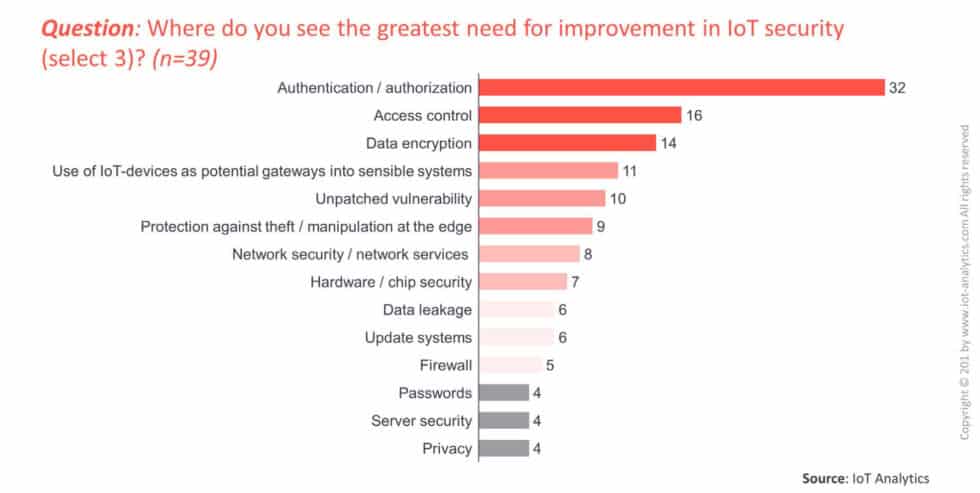
IoT Security Market Report 2017-2022
- 48% of businesses are unable to detect if any of their IoT devices are impacted by a security breach (Gemalto The State of IoT Security 2018)
- 79% believe governments around the world should provide stronger guidelines regarding IoT security (Gemalto The State of IoT Security 2018)
- 19% use blockchain technology to help secure data flowing through IoT devices, up from 9% in 2017 (Gemalto The State of IoT Security 2018)
- 97% believe strong IoT security can be a key competitive differentiator (Gemalto The State of IoT Security 2018)
- 59% consider that IoT security regulations should define and assign responsibility for this particular aspect (Gemalto The State of IoT Security 2018)
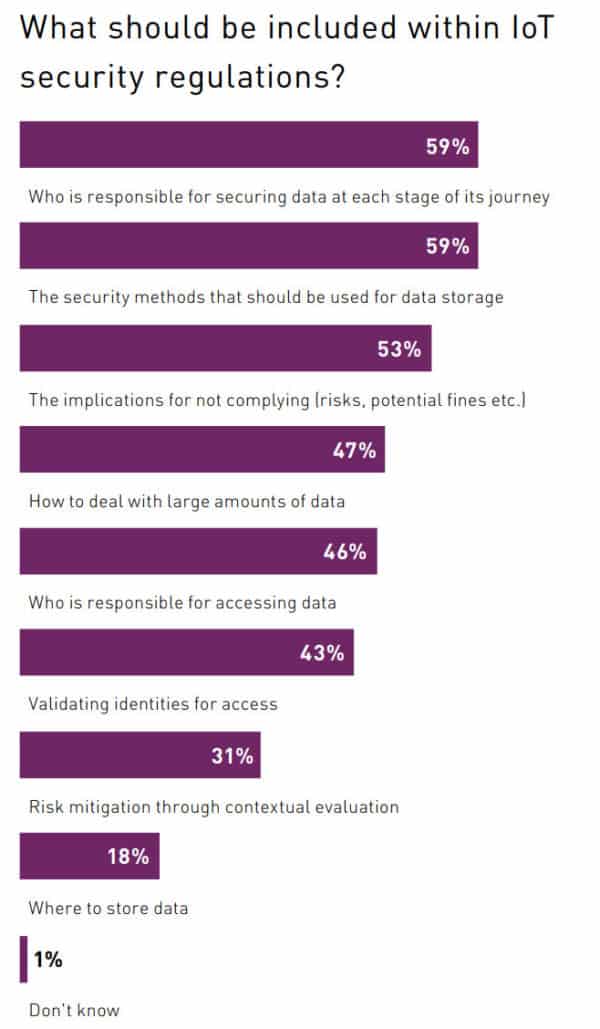
Gemalto The State of IoT Security 2018
Social media scams and attacks spread like wildfire
With billions of users and everyday usage skyrocketing, social media platforms became a goldmine for cybercriminals and scammers.
From Cambridge Analytica to huge data breaches, malicious actors of all kinds made headlines almost every day throughout 2018. The reality is that 2019 doesn’t look any better.
Attitudes regarding social media seem to be changing but behaviors aren’t following suit, which leaves bad actors with plenty of opportunities to steal data and defraud users across the globe.
- 96% of Baby Boomers are distrustful of social media when it comes to protecting their data, followed by 94% of Gen Xers, 93% of Gen Z, and 92% of Millennials. (The Blinding Effect of Security Hubris on Data Privacy by Malwarebytes)
An overwhelming majority of all users (94 percent) refrain from sharing personal information on social media and 95 percent of polled users felt an overall sense of distrust for social media networks. If given the option to “choose the lesser evil,” they’d rather forgo using social media than search engines.
The Blinding Effect of Security Hubris on Data Privacy by Malwarebytes
- Given that crimes involving social media grew more than 300-fold between 2015-2017 in the US, this is quickly becoming one of the most pressing issues in the tech world (Bromium Into The Web of Profit – Social media platforms and the cybercrime economy)
- UK police statistics show social media-enabled crime quadrupled between 2013 and 2018 (Bromium Into The Web of Profit – Social media platforms and the cybercrime economy)
Over 1.3 billion social media users have had their data compromised within the last five years and between 45-50% of the illicit trading of data from 2017 to 2018 could be associated with breaches of social media platforms, like LinkedIn and Facebook.
Bromium Into The Web of Profit – Social media platforms and the cybercrime economy
- The social media issue goes even deeper: 59% feel it’s unethical for social media platforms to tailor newsfeeds (RSA Data Privacy & Security Survey 2019)
- 67% of UK consumers believe recommendations based on purchase/browsing history are unethical (RSA Data Privacy & Security Survey 2019)
- Speaking of newsfeeds, did you know that around 30-40% of social media infections come from infected ads? (Bromium Into The Web of Profit – Social media platforms and the cybercrime economy)
- Cybercriminals are also leveraging social media to promote their hacking services: around 30-40% of the social media platforms feature accounts offering some form of hacking activities (Bromium Into The Web of Profit – Social media platforms and the cybercrime economy)
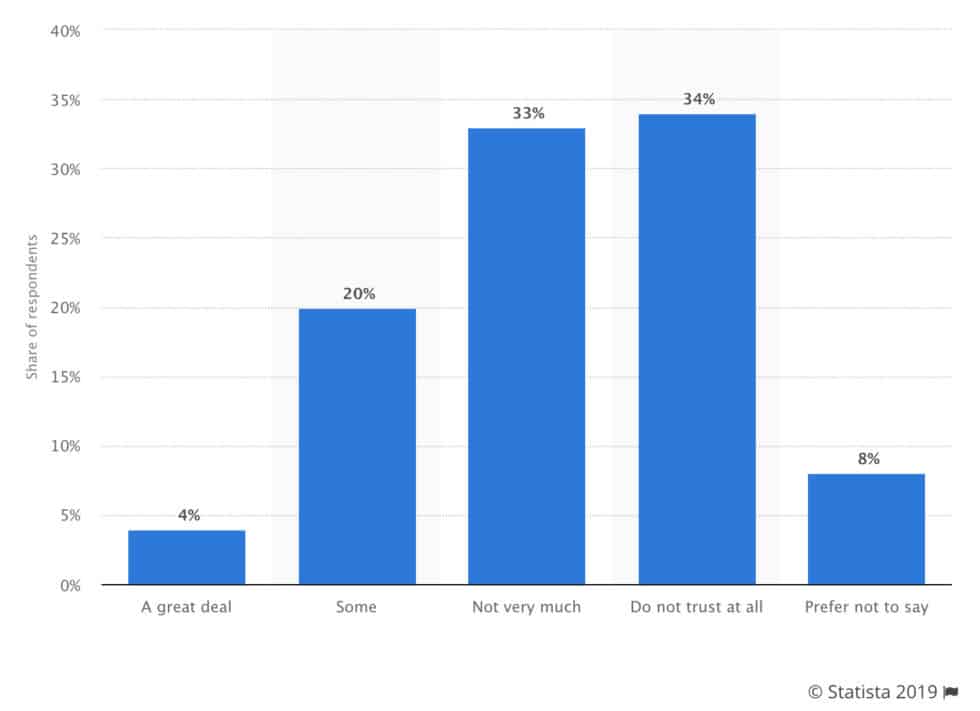
- No wonder 34% of US adults don’t trust social media companies at all with safeguarding their personal data (Statista)
- In 2017, 53% of the most popular fraud-related posts on Facebook led to carding services or credit card fraud (RSA 2018 Current State of Cybercrime)
- Social media phishing increased by 200% from 2016 to 2017 as attackers seek to collect information shared on these platforms to use in subsequent attacks (ENISA Threat Landscape Report 2018)
- At least 20% of social media infections stem from add-ons or plugins for social media platforms (Bromium Into The Web of Profit – Social media platforms and the cybercrime economy)
Data breaches and leaks expose everyone, becoming the fourth most important global risk for the next decade
So much personal and confidential data has leaked onto the web that it’s becoming a societal issue. Regulators around the world are trying to find solutions for this but, until they do, the onslaught continues.
- In 2018 there was a total of 1244 data breaches (21% less than in 2017) that exposed 446,52 million records, a staggering 148% increase from 2017. (Statista)
- “Massive data fraud and theft” ranked as the fourth most important global risk for the next 10 years, followed by cyberattacks at number five (The Global Risks Report 2019 – World Economic Forum)
- Cybersecurity company RSA predicts mass data breaches will continue to play a large role in cybersecurity threats. (RSA)
- 43% of data breaches involved small business as victims (Verizon 2019 Data Breach Investigations Report)
- 33% included social engineering attacks, with phishing, pretexting, and bribery as the most common malicious actions (Verizon 2019 Data Breach Investigations Report)
- 71% of breaches were financially motivated (Verizon 2019 Data Breach Investigations Report)
- Errors caused 21% of data breaches in 2018 (Verizon 2019 Data Breach Investigations Report)
- The most frequently compromised sets of data in breaches are internal information, credentials, personal data, medical information and payment details (Verizon 2019 Data Breach Investigations Report)
- In 2017, Wikileaks released a stash of over 8,000 classified CIA documents. (New York Times)
- That same year, hackers released 2GB of emails from French presidential candidate Emmanuel Macron. (Reuters)
- McAfee finds the average number of records lost to hacking in 2017 was 780,000 per day. (McAfee)
- As a result of the growing number of data breaches, personal data is easier to buy on the dark web than ever. Bromium reports personal data (social security information, date of birth, residential addresses, etc.) can cost as little s $3. (Bromium Into The Web of Profit – Understanding the growth of the cybercrime economy)
- A large amount of private and stolen consumer information is being shared online through social media groups built around such activity. Credit card services make up 53% of the topics discussed in such groups, followed very distantly by account takeovers with 16% (RSA)
Malicious cyber-attacks and lenient cybersecurity processes again led to massive breaches of personal information in 2018.
The largest was in India, where the government ID database, Aadhaar, reportedly suffered multiple breaches that potentially compromised the records of all 1,1 billion registered citizens.
It was reported in January that criminals were selling access to the database at a rate of 500 rupees ($7,3) for 10 minutes, while in March a leak at a state-owned utility company allowed anyone to download names and ID numbers.
The Global Risks Report 2019 – World Economic Forum
- The most affected industries by breaches targeting payment card data are retail (17%), finance and insurance (13%), and hospitality (12%) (2018 Trustwave Global Security Report)
- 32% of information security professionals admitted that breaches affected more than half of their systems more than double when compared to 2016 (15%) (Cisco Annual Cybersecurity Report 2018)
- Besides financial costs, 55% of organizations have had to manage the public scrutiny of a breach (Cisco Annual Cybersecurity Report 2018)
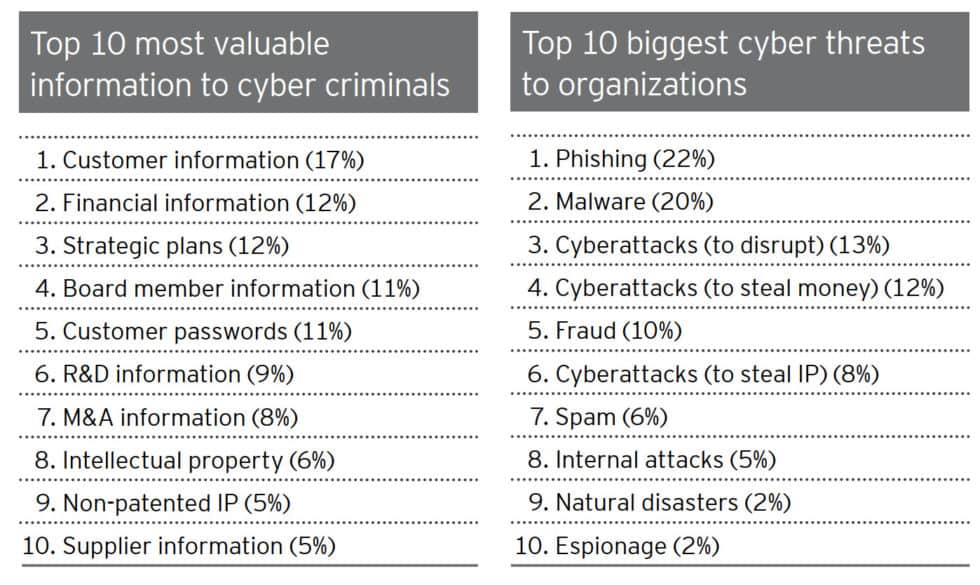
- 17% of organizations cited losing their customers’ information as their biggest fear (EY Global Information Security Survey 2018-2019)
- 56% of breaches took several months or longer to discover (Verizon 2019 Data Breach Investigations Report)
- There’s been a 141% increase in North America, a 22% decrease in Europe, and a 36% decrease in Asia in terms of volume of compromised credentials, and this is just counting the figures reported over the past year (ENISA Threat Landscape Report 2018)
- Nearly 47% of data breaches in the public sector were discovered years after the initial attack (Verizon 2019 Data Breach Investigations Report)
- Public institutions suffered the highest volume of attacks: from a total of 23,399 incidents, 330 breaches featured confirmed data disclosure (Verizon 2019 Data Breach Investigations Report)
- 2 million identities were stolen and used to leave fake comments during a US inquiry into net neutrality (EY Global Information Security Survey 2018-2019)
- 1,946,181,599 records containing personal and other sensitive data were compromised between January 2017 and March 2018 (EY Global Information Security Survey 2018-2019)
- $3,62m is the average cost of a data breach in 2018 (EY Global Information Security Survey 2018-2019)
- In the UK, the average cost of a breach is £3,100 for small businesses £16,100 for medium businesses, and £22,300 for large businesses (ENISA Cyber Security Breaches Survey 2018)
- The average global cost for a data breach is $7,611 (Verizon 2019 Data Breach Investigations Report)
- Breaching social media platforms accounted for the highest number of records spilled onto the internet in 2018 (56%).Facebook accounted for over 2.2 billion records and Twitter with 336 million records (ENISA Threat Landscape Report 2018)
- Healthcare records the largest number of data breaches (27%) with the most severe incident exposing 3,5 million records (ENISA Threat Landscape Report 2018)
- In healthcare, 60% of attacks that target data are carried out by insiders, higher than any other industry (Verizon 2019 Data Breach Investigations Report)
- Identity theft remains the main type of data breach with 56% – as has been the case since 2013 (ENISA Threat Landscape Report 2018)
EY Global Information Security Survey 2018-2019
- In spite of these appalling statistics, only 17% of organizations report breaches in their information security reports (EY Global Information Security Survey 2018-2019)
- Another worrisome aspect is that “10% of the UK healthcare organizations have been breached more than 10 times in the last year” (ENISA Threat Landscape Report 2018)
- 33% of healthcare companies cite careless or unaware employees as the vulnerability that has most increased their risk exposure over the past 12 months (EY Global Information Security Survey 2018-2019)
- Command and control (C2) is the most common form of attack (47%) in data breach incidents, followed by ransomware with 28% (Verizon 2019 Data Breach Investigations Report)
- 38% of energy companies admit that it would be unlikely they could detect a sophisticated breach (EY Global Information Security Survey 2018-2019)
- Surprisingly, device loss accounts for around 50% of all breaches (ENISA Threat Landscape Report 2018)
- Europol reports external individual malicious actors carried out 73% of the breaches, while 50% were attributed to organized crime groups (ENISA Threat Landscape Report 2018)
- 84% of data breaches caused by botnets in 2018 were in Finance and Insurance, 10% in Information, and 5% in Professional, Scientific, and Technical Services (Verizon 2019 Data Breach Investigations Report)
- Data breaches caused by botnet attacks covered 180 countries and territories in 2018 (Verizon 2019 Data Breach Investigations Report)
- 98.5% of security incidents and 88% of data breaches can be classified in one of the nine patterns information security professional established years ago: POS intrusion, web app attack, insider and privilege misuse, physical theft or loss, miscellaneous errors, crimeware, payment card skimmers, Denial of Service, cyber-espionage (Verizon 2019 Data Breach Investigations Report)
Additionally, our own research at Comparitech highlights that Wall Street swiftly reacts to data breaches. We analyzed how cybersecurity breaches impact stock market prices and found out that:
- On average, stocks immediately experience a drop of 0.43% in share price following a breach
- Long-term effects include a much slower upturn in terms of share prices. We observed a 45.6% increase in share prices during the three years prior to breach, and only a 14.8% growth in the three years following the compromise
- Breached companies recover to NASDAQ’s pre-breach performance level after 38 days on average, but three years after the breach they still underperform the index by a margin of over 40%
- When they suffer a data breach, financial organizations experience an immediate decline in share price whereas internet businesses (e-commerce, social media, etc.) most frequently endure long-term effects
- Larger breaches have less of a negative influence on share prices than smaller breaches
- Breaches involving credit card details and social security numbers register a more significant negative impact on share prices than leaks containing less sensitive info, such as email addresses.
The entire analysis reveals other interesting consequences for breached companies, both in terms of financial aspects and nonfinancial ones, such as reputation and brand trust.
Users are more worried about cybercrime statistics but fail to follow through with protecting their assets
Cybersecurity statistics clearly show that technology has its limitations when it comes to safeguarding assets such as confidential data and money. To truly make strides in better protection from cybercriminals and online crooks, user behavior must be improved as well.
- Up to 73% of users reuse passwords across their online accounts, which inherently leads to a higher risk of password theft and credential misuse. (RSA Data Privacy & Security Survey 2019)
- 66% of surveyed users said they simply skim through or do not read End-User License Agreements or other consent forms. (The Blinding Effect of Security Hubris on Data Privacy by Malwarebytes)
- Only 47% know which permissions their apps have. (The Blinding Effect of Security Hubris on Data Privacy by Malwarebytes)
- 71% of Americans worry about having their personal, credit card or financial information stolen by malicious hackers. (Statista)
- 78% of people in the UK are most concerned about identity theft resulting in financial loss. (RSA Data Privacy & Security Survey 2019)
- 96% of people polled for a study mention they care about their privacy, and 93% of them use security software. (The Blinding Effect of Security Hubris on Data Privacy by Malwarebytes)
- 42% of Gen Z stated they feared blackmail in 2018. On average, only 34% of all respondents were concerned about this threat. (RSA Data Privacy & Security Survey 2019)
- 75% of consumers now limit the amount of personal information they share online (RSA Data Privacy & Security Survey 2019)
- And they do so for good reason: internationally, 36% of people surveyed by RSA said their personal information was compromised in a data breach over the last 5 years, and 45% of US respondents confirmed the same. (RSA Data Privacy & Security Survey 2019)
- What’s more, 58% of U.S. respondents said they’d consider divesting from companies that disregard protecting their data. (RSA Data Privacy & Security Survey 2019)
- Surprisingly, 76% of consumers in 21 countries acknowledge the importance of keeping their account information secure, yet many still share their passwords, among other risky behaviors with their data. A further 35% allow at least one device to go unprotected and vulnerable to all forms of viruses and malware. (Symantec)
- But there’s good news as well: a little over 53% of people now use password managers. ((The Blinding Effect of Security Hubris on Data Privacy by Malwarebytes)
- A vast majority of U.S. consumers (80 percent) now have a home internet network. One in ten has also experienced a cyber attack through their home networks. (Hartford Steam Boiler)
- 72 percent of people globally believe that connected home devices offer hackers new ways to steal data. (Symantec)
- But the downside is that 41% of people cannot properly identify a phishing email and are often unsure about an email’s legitimacy. (Symantec)
- Cyberbullying is a primary concern in the US, where 64 percent of parents believe their children are more likely to experience bullying. By comparison, only 31 percent of parents in Germany share this concern. (Symantec)
- In the past year, nearly 700 million people in 21 countries experienced some form of cybercrime. (Symantec)
The issues are even bigger in an organizational environment, whether private or public:
- 1 out of 3 employees risk running malware on a work computer (Penetration testing of corporate information systems: statistics and findings 2019 – Positive Technologies)
- When penetration testers were on the field, they discovered that 1 out of 7 employees engaged in dialog with an imposter and disclosed confidential information (Penetration testing of corporate information systems: statistics and findings 2019 – Positive Technologies)
- 1 out of 10 employees entered account credentials in a fake authentication form (Penetration testing of corporate information systems: statistics and findings 2019 – Positive Technologies)
- 1,464 government officials in one state used “Password123” as their password (EY Global Information Security Survey 2018-2019)
- Over 74 percent of surveyed small businesses state that they’ve never been the victim of a successful cyber attack (in contrast to other data which reports higher rates of successful attacks against small businesses). (NDIA 2019 Cybersecurity Report)
Click HERE for source.